Install an integration
Port is designed to be flexible. It can be integrated with any tool, and can be used to build a software catalog that reflects your exact data model.
Port comes with a wide variety of available integrations for popular tools and platforms, modeled and configured by us to provide you with a plug & play experience.
Once installed, you can customize and extend these integrations to fit your exact needs.
Don't see the tool you wish to integrate with Port in the available integrations below?
Port provides you with the required tools to model your data and ingest it with ease, see Create a custom integration.
Integration process
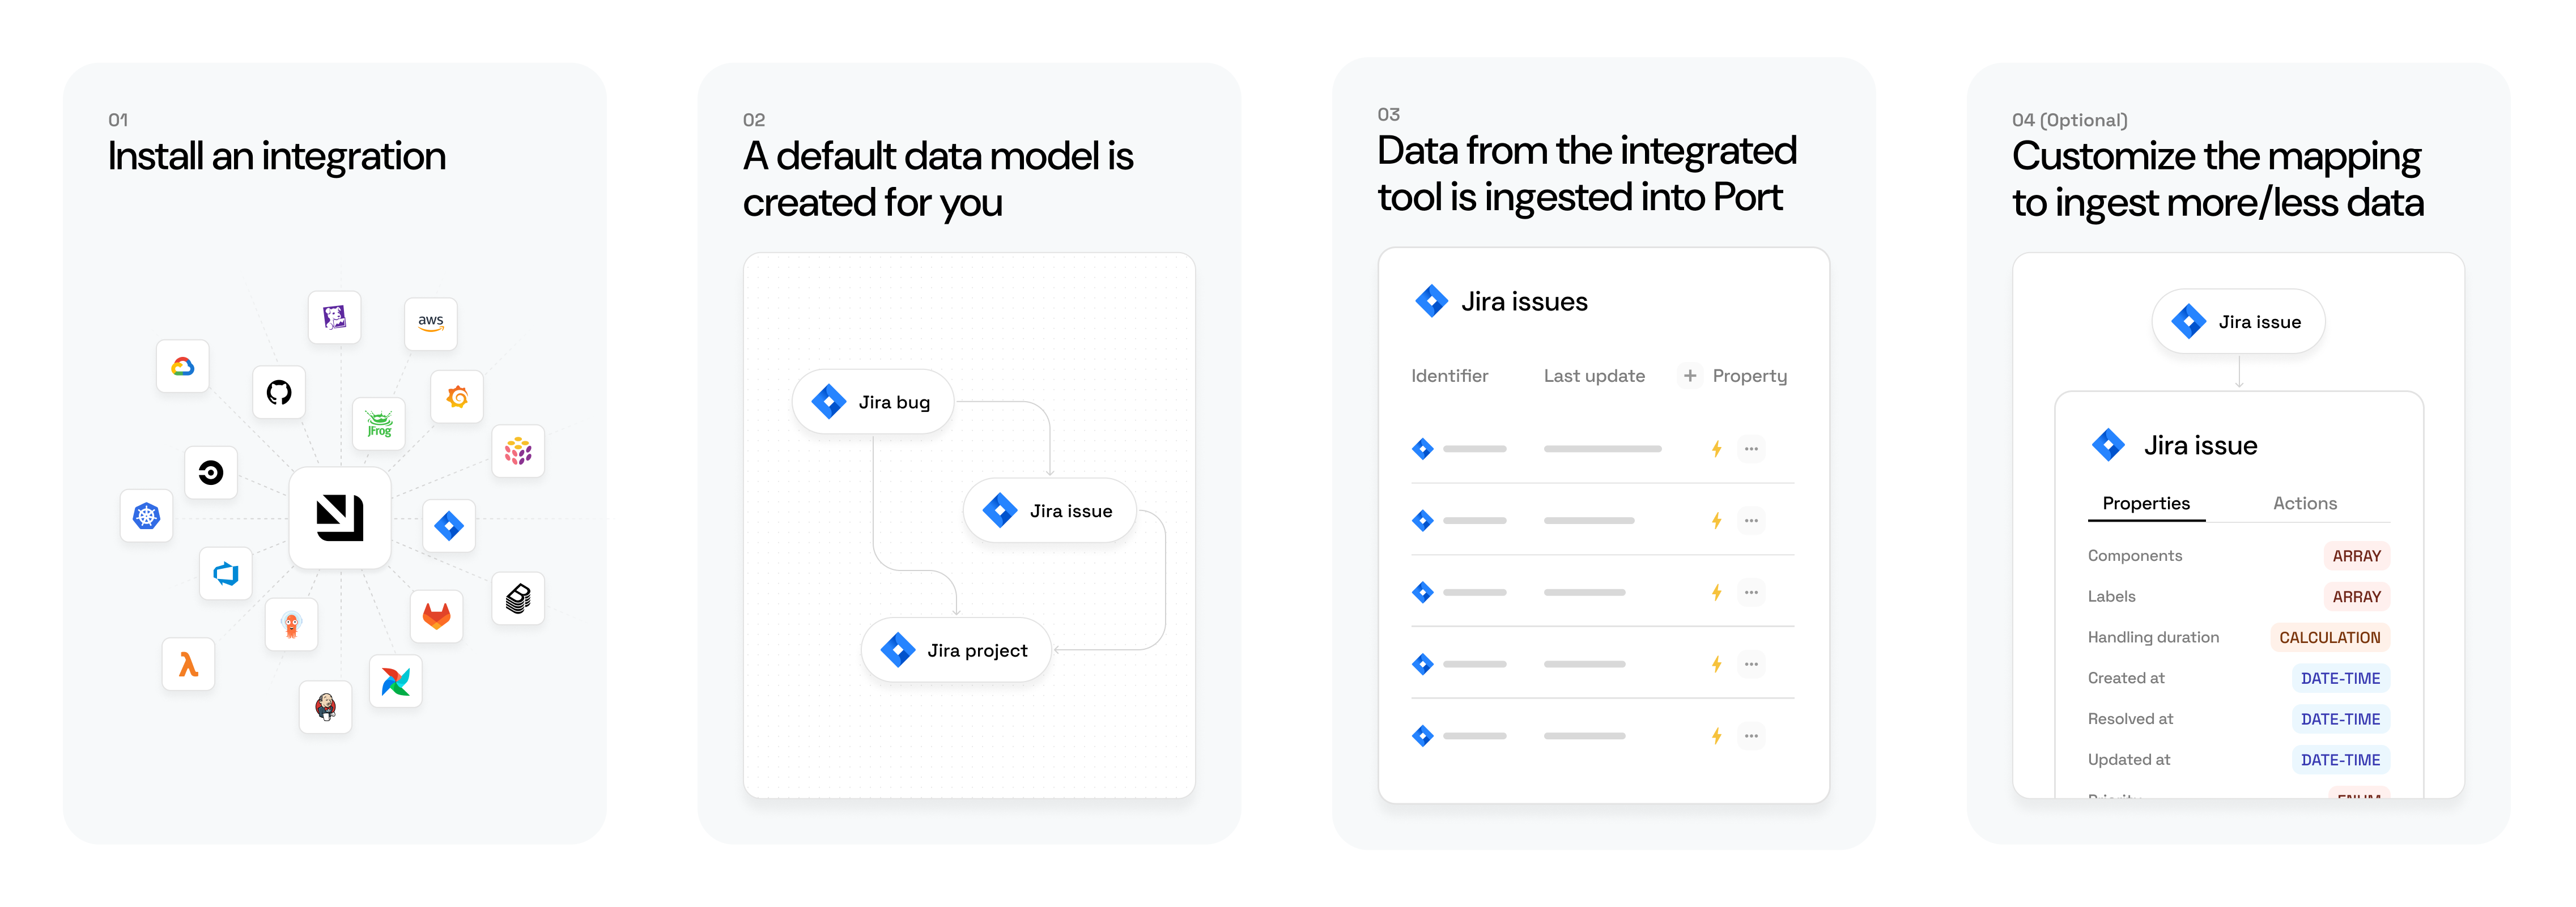
Generally, installing an available integration results in the following:
-
The integration's default data model is created for you:
- Default blueprints will be created in the Builder page of your portal.
- Default mapping will be defined in the integration's data source page.
-
Data from the integrated tool is ingested into Port.
The sync mechanism and frequency depend on the installation method.
After the installation, you can customize the blueprints and/or mapping to ingest more/less data (see below).
Available plug & play integrations
Most of Port's integrations were developed using the Ocean framework.
Ocean is an open-source framework that simplifies the development of integrations with external tools, providing many out-of-the-box functionalities.
Want to contribute an integration? Check out the Ocean documentation to get started, and reach out to us if you have any questions 🌟
Customize your integrations
Now that you've installed an integration, let's see how you can customize it:
-
Configure your data model - Update the integration's data model in Port to ingest additional data that is not included by default.
-
Configure your data mapping - Update the integration's data mapping in Port to match the data model and fetch your desired data from the tool.
Entities
An entity is an instance of a blueprint, it represents the data defined by a blueprint's properties.
After installing an integration, a page will be created in your catalog, populated with entities representing the ingested data.
For example, once you complete Port's onboarding process and connect your Git provider to Port, a new Services page will be created in your software catalog, populated with entities representing your services (Git repositories):
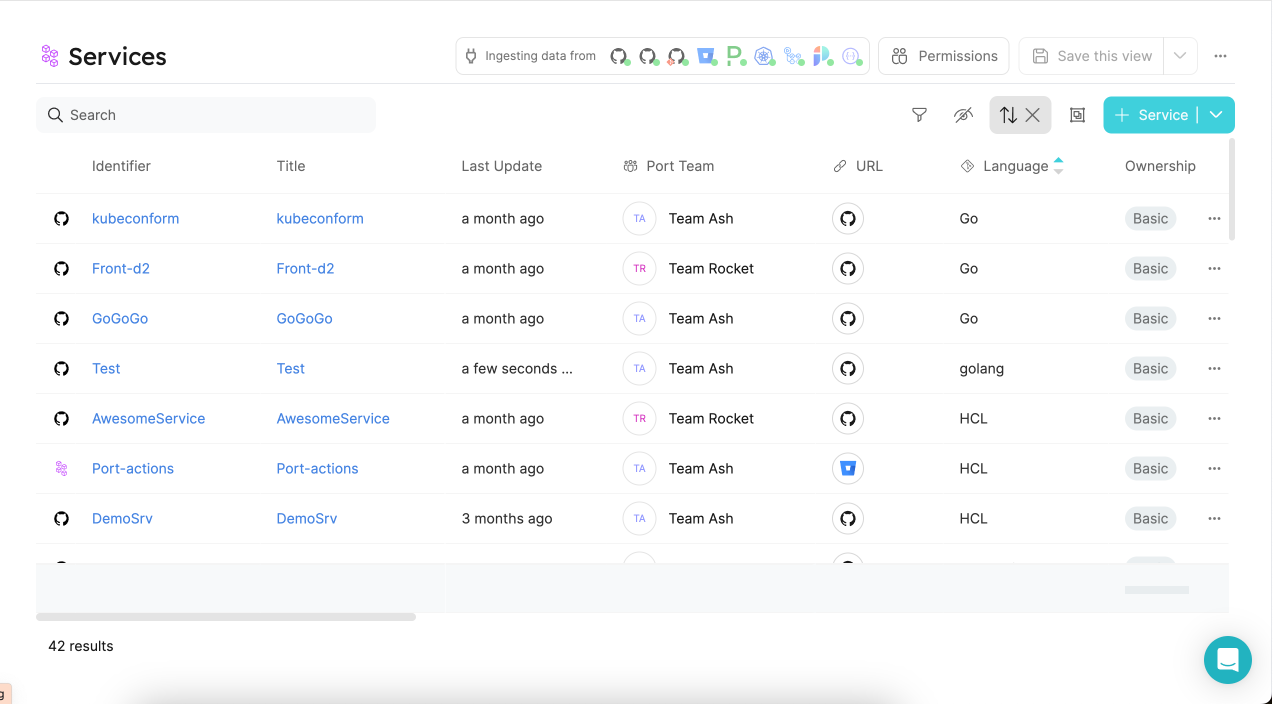
Clicking on an entity in the table will take to its entity page, where you can view its properties, relations and more.
Entity structure
By default, each entity has the following meta-properties: identifier, title, team. See the table below for more details.
JSON structure
{
  "identifier": "unique-ID",
  "title": "Title",
  "team": [],
  "blueprint": "blueprintName",
  "properties": {
    "property1": "",
    "property2": ""
  },
  "relations": {}
}
Structure table
| Field | Type | Description |
|---|---|---|
identifier | String | Unique identifier. Note that while the identifier is unique, it can be changed after creation. |
title | String | Entity name that will be shown in the UI. |
team | Array | Optional Field. An array of the associated teams. |
blueprint | String | The name of the blueprint that this entity is based on. |
properties | Object | An object containing key-value pairs, where each key is a property as defined in the blueprint definition, and each value matches the type of the property. |
relations | object | An object containing key-value pairs. Each key is the identifier of the relation that is defined on the blueprint. |
Monitoring and sync status
Every integration has a dedicated page that displays detailed monitoring metrics and sync status, helping you track the data ingestion process. This monitoring view is available for all Ocean integrations.
To access the integration's monitoring metrics and sync status, navigate to the data sources page. Under the Exporters section, select your integration.
The Sync Status tab offers a detailed overview of the data ingestion and reconciliation processeses.
It includes the following sections:
Sync by kind
Shows the monitoring metrics and sync status for each kind.
Sync stages overview:
- Fetch data:
The first step in the data ingestion process is fetching the data from the data source.
In this section, you will find the following fields:- Fetched: Number of objects fetched from the data source.
- Failed: If the fetch fails, this field will show
1andFetchedwill show0. Otherwise, it shows0.
- Map data:
The next step is mapping these objects according to the integration's mapping configuration.
In this section, you will find the following fields:- Transformed: Number of objects that were mapped to blueprint entities.
- Filtered out: Number of objects that were filtered out according to the mapping conditions.
- Failed: Number of objects that failed to map, you can find more information about the failure reasons in the Troubleshooting tips section below in the UI or refer to the
Audit logorEvent logtabs, available in the same window.
- Ingest to Port:
Final step is ingesting the mapped objects to Port.
In this section, you will find the following fields:- Ingested: Number of objects that were inserted or updated successfully.
- Not changed: Number of objects that were already up to date, so no changes were made to them.
- Failed: Number of objects that failed to ingest. To learn more about the failure reasons, see the
Audit logorEvent logtabs, available in the same window.
Details: Displays the duration of the sync.
Reconciliation
This section provides visibility into both the reingestion and deletion processes.
When the createMissingRelatedEntities flag is set to false, Port will not automatically create related entities that are referenced in the mapping but not yet present in Port. The reingestion process ensures that once the missing related entities are ingested, the dependent entities will be reingested.
The deletion process ensures that entities that are no longer present in the data source are removed.
In this section, you will find the following data:
Ingestion retry:
- Reingested entities: Displays the number of entities that were ingested successfully on retry after dependencies resolved.
- Failed: Displays the number of entities that failed to reingest.
Delete:
- Deleted entities: Displays the number of entities that were removed from Port to match the data source.
- Failed: Displays the number of entities that failed to delete.
Details: Displays the duration of the reconciliation.
Note: The same data is also available through the Get an integration's metrics and sync status API endpoint.
If you are using the self hosted integration method, you can get raw Prometheus metrics by accessing the following endpoint: {your_integration's_base_url}/metrics/.
FAQ
Which integrations support this view? (Click to expand)
The monitoring view is available for all Ocean integrations, including both SaaS and on-premise environments.
Can I view previous syncs data? (Click to expand)
The monitoring page displays data only from the most recent sync. Historical sync information is not currently retained in this view.
What are the troubleshooting tips based on? (Click to expand)
The troubleshooting tips are based on the observed metrics at each sync stage. They offer context-aware suggestions depending on the sync outcome. For example, if no data is fetched, the tip might recommend checking the integration's permissions. These tips are not tied to error logs.
When is the monitoring view updated? (Click to expand)
The monitoring view is updated following every sync, whether it is scheduled or manually triggered.
Does ingestion retry always attempt to process all failures? (Click to expand)
No, retries only apply when CreateMissingRelatedEntities is set to false.
Can I see the reasons for sync failures? (Click to expand)
The monitoring view includes potential failure via troubleshooting tips, but they are not definitive. For more detailed and precise insights, refer to the Audit Log and Event Log tabs at the top of the modal.
What happens if the same kind appears more than once in the mapping? (Click to expand)
If a kind appears multiple times in the mapping file, it will also appear multiple times in the monitoring view, following the exact order defined in the mapping.