Visualize and manage your Statuspage incidents
This guide demonstrates how to bring your Statuspage incidents management experience into Port. You will learn how to:
- Ingest Statuspage incidents data into Port's software catalog using Port's Statuspage integration.
- Set up self-service actions to create and update incidents.
- Create an automation to reflect incident changes in Port.
- Build dashboards in Port to monitor and act on incidents.
Common use cases
- Monitor and manage all Statuspage incidents from a centralized dashboard.
- Empower teams to create and update incidents through self-service actions.
Prerequisites
This guide assumes the following:
- You have a Port account and have completed the onboarding process.
- Port's Statuspage integration is installed in your account.
Set up self-service actions
We will create two self-service actions in Port to directly interact with the Statuspage REST API. These actions will let users create new incidents and update existing ones.
The actions will be configured via JSON and triggered using synced webhooks secured with secrets. To implement this use-case, follow the steps below:
Add Port secrets
To add a secret to your portal:
-
Click on the
...button in the top right corner of your Port application. -
Click on Credentials.
-
Click on the
Secretstab. -
Click on
+ Secretand add the following secret:_STATUSPAGE_API_KEY: Your Statuspage API key. Follow the Statuspage documentation on how to create the API key.
Create a new incident
-
Go to the Self-service page of your portal.
-
Click on the
+ New Actionbutton. -
Click on the
{...} Edit JSONbutton. -
Copy and paste the following JSON configuration into the editor.
Create Statuspage incident action (Click to expand)
{
  "identifier": "create_statuspage_incident",
  "title": "Create Statuspage Incident",
  "icon": "Alert",
  "description": "Trigger a new Statuspage incident against your Atlasssian page and components",
  "trigger": {
    "type": "self-service",
    "operation": "CREATE",
    "userInputs": {
      "properties": {
        "incident_title": {
          "type": "string",
          "title": "Incident Title",
          "description": "Concise title for the incident"
        },
        "incident_message": {
          "type": "string",
          "title": "Incident Description",
          "description": "Detailed description of the incident"
        },
        "incident_severity": {
          "icon": "DefaultProperty",
          "title": "Incident Severity",
          "type": "string",
          "enum": [
            "none",
            "minor",
            "major",
            "critical",
            "maintenance"
          ],
          "enumColors": {
            "none": "lightGray",
            "minor": "yellow",
            "major": "gold",
            "critical": "red",
            "maintenance": "blue"
          }
        },
        "incident_status": {
          "icon": "DefaultProperty",
          "title": "Incident Status",
          "type": "string",
          "enum": [
            "investigating",
            "identified",
            "monitoring",
            "resolved",
            "scheduled",
            "in_progress",
            "verifying",
            "completed"
          ],
          "enumColors": {
            "investigating": "blue",
            "identified": "orange",
            "monitoring": "yellow",
            "resolved": "green",
            "scheduled": "lightGray",
            "in_progress": "blue",
            "verifying": "yellow",
            "completed": "green"
          }
        },
        "status_page": {
          "type": "string",
          "title": "Status Page",
          "blueprint": "statuspage",
          "description": "The status page",
          "format": "entity"
        },
        "impacted_components": {
          "title": "Impacted Components",
          "icon": "DefaultProperty",
          "type": "array",
          "items": {
            "type": "string",
            "format": "entity",
            "blueprint": "statuspageComponent"
          }
        },
        "send_notifications": {
          "type": "boolean",
          "title": "Send Notifications",
          "default": true,
          "description": "Whether or not to deliver notifications to subscribers"
        },
        "scheduled_for": {
          "title": "Scheduled For",
          "icon": "DefaultProperty",
          "type": "string",
          "description": "The timestamp the incident is scheduled for",
          "format": "date-time",
          "visible": {
            "jqQuery": ".form.incident_status | IN(\"scheduled\", \"in_progress\", \"verifying\", \"completed\")"
          }
        },
        "scheduled_until": {
          "type": "string",
          "title": "Scheduled Until",
          "description": "The timestamp the incident is scheduled until",
          "format": "date-time",
          "visible": {
            "jqQuery": ".form.incident_status | IN(\"scheduled\", \"in_progress\", \"verifying\", \"completed\")"
          }
        }
      },
      "required": [
        "incident_title",
        "incident_message",
        "incident_severity",
        "incident_status",
        "impacted_components",
        "send_notifications"
      ],
      "order": [
        "incident_title",
        "incident_message",
        "incident_severity",
        "incident_status",
        "status_page",
        "impacted_components",
        "send_notifications",
        "scheduled_for",
        "scheduled_until"
      ]
    },
    "blueprintIdentifier": "statuspageIncident"
  },
  "invocationMethod": {
    "type": "WEBHOOK",
    "url": "https://api.statuspage.io/v1/pages/{{.inputs.status_page.identifier}}/incidents",
    "agent": false,
    "synchronized": true,
    "method": "POST",
    "headers": {
      "Content-Type": "application/json",
      "Authorization": "OAuth {{.secrets._STATUSPAGE_API_KEY}}"
    },
    "body": {
      "incident": {
        "name": "{{ .inputs.incident_title }}",
        "body": "{{ .inputs.incident_message }}",
        "status": "{{ .inputs.incident_status }}",
        "impact_override": "{{ .inputs.incident_severity }}",
        "deliver_notifications": "{{ .inputs.send_notifications }}",
        "component_ids": "{{ .inputs.impacted_components | map(.identifier) }}",
        "{{ if (.inputs | has(\"scheduled_for\")) then \"scheduled_for\" else null end }}": "{{ if (.inputs | has(\"scheduled_for\")) then .inputs.scheduled_for else null end }}",
        "{{ if (.inputs | has(\"scheduled_until\")) then \"scheduled_until\" else null end }}": "{{ if (.inputs | has(\"scheduled_until\")) then .inputs.scheduled_until else null end }}",
        "metadata": {
          "port": {
            "runId": "{{ .run.id }}",
            "triggeredBy": "{{ .trigger.by.user.email }}"
          }
        }
      }
    }
  },
  "requiredApproval": false
} -
Click
Save.
Update incident status
-
Go to the Self-service page of your portal.
-
Click on the
+ New Actionbutton. -
Click on the
{...} Edit JSONbutton. -
Copy and paste the following JSON configuration into the editor.
Update Statuspage incident status action (Click to expand)
{
  "identifier": "update_statuspage_incident",
  "title": "Update Statuspage Incident",
  "icon": "Alert",
  "description": "Update the status of an existing Statuspage incident",
  "trigger": {
    "type": "self-service",
    "operation": "DAY-2",
    "userInputs": {
      "properties": {
        "new_incident_status": {
          "icon": "DefaultProperty",
          "title": "New Incident Status",
          "type": "string",
          "enum": [
            "investigating",
            "identified",
            "monitoring",
            "resolved"
          ],
          "enumColors": {
            "investigating": "blue",
            "identified": "orange",
            "monitoring": "yellow",
            "resolved": "green"
          }
        },
        "update_message": {
          "type": "string",
          "title": "Update Message (Optional)"
        }
      },
      "required": [
        "new_incident_status"
      ],
      "order": [
        "new_incident_status",
        "update_message"
      ]
    },
    "blueprintIdentifier": "statuspageIncident"
  },
  "invocationMethod": {
    "type": "WEBHOOK",
    "url": "https://api.statuspage.io/v1/pages/{{.entity.relations.statuspage}}/incidents/{{.entity.identifier}}",
    "agent": false,
    "synchronized": true,
    "method": "PATCH",
    "headers": {
      "Content-Type": "application/json",
      "Authorization": "OAuth {{.secrets._STATUSPAGE_API_KEY}}"
    },
    "body": {
      "incident": {
        "status": "{{ .inputs.new_incident_status }}",
        "{{ if (.inputs | has(\"update_message\")) then \"body\" else null end }}": "{{ if (.inputs | has(\"update_message\")) then .inputs.update_message else null end }}",
        "metadata": {
          "port": {
            "runId": "{{ .run.id }}",
            "triggeredBy": "{{ .trigger.by.user.email }}"
          }
        }
      }
    }
  },
  "requiredApproval": false
} -
Click
Save.
Now you should see the Create Statuspage Incident and Update Statuspage Incident actions in the self-service page. 🎉
Set up automation
We will create an automation to reflect incident changes in Port's software catalog. This ensures that our dashboards always show the most up-to-date information.
-
Go to the Automations page of your portal.
-
Click on the
+ New Automationbutton. -
Click on the
{...} Edit JSONbutton. -
Copy and paste the following JSON configurations into the editor while clicking
Savefor each configuration.Statuspage incident creation automation (Click to expand)
{
  "identifier": "statuspage_incident_sync_status",
  "title": "Create Statuspage Incident in Port",
  "description": "Reflects Statuspage incident changes in Port",
  "trigger": {
    "type": "automation",
    "event": {
      "type": "RUN_UPDATED",
      "actionIdentifier": "create_statuspage_incident"
    },
    "condition": {
      "type": "JQ",
      "expressions": [
        ".diff.after.status == \"SUCCESS\""
      ],
      "combinator": "and"
    }
  },
  "invocationMethod": {
    "type": "UPSERT_ENTITY",
    "blueprintIdentifier": "statuspageIncident",
    "mapping": {
      "identifier": "{{.event.diff.after.response.id}}",
      "title": "{{.event.diff.after.response.name}}",
      "properties": {
        "status": "{{.event.diff.after.response.status}}",
        "impact": "{{.event.diff.after.response.impact}}",
        "createdAt": "{{.event.diff.after.response.created_at}}",
        "updatedAt": "{{.event.diff.after.response.updated_at}}",
        "startedAt": "{{.event.diff.after.response.started_at}}",
        "resolvedAt": "{{.event.diff.after.response.resolved_at}}",
        "shortlink": "{{.event.diff.after.response.shortlink}}",
        "scheduled_for": "{{.event.diff.after.response.scheduled_for}}",
        "scheduled_until": "{{.event.diff.after.response.scheduled_until}}",
        "scheduled_remind_prior": "{{.event.diff.after.response.scheduled_remind_prior}}",
        "scheduled_reminded_at": "{{.event.diff.after.response.scheduled_reminded_at}}",
        "impact_override": "{{.event.diff.after.response.impact_override}}",
        "scheduled_auto_in_progress": "{{.event.diff.after.response.scheduled_auto_in_progress}}",
        "scheduled_auto_completed": "{{.event.diff.after.response.scheduled_auto_completed}}",
        "metadata": "{{.event.diff.after.response.metadata}}",
        "reminder_intervals": "{{.event.diff.after.response.reminder_intervals}}",
        "postmortem_body": "{{.event.diff.after.response.postmortem_body}}",
        "postmortem_body_last_updated_at": "{{.event.diff.after.response.postmortem_body_last_updated_at}}",
        "postmortem_ignored": "{{.event.diff.after.response.postmortem_ignored}}",
        "postmortem_published_at": "{{.event.diff.after.response.postmortem_published_at}}",
        "postmortem_notified_subscribers": "{{.event.diff.after.response.postmortem_notified_subscribers}}",
        "postmortem_notified_twitter": "{{.event.diff.after.response.postmortem_notified_twitter}}"
      },
      "relations": {
        "statuspage": "{{.event.diff.after.response.page_id}}",
        "components": "{{.event.diff.after.response.components | map(.id)  }}"
      }
    }
  },
  "publish": true
}
Statuspage incident status update automation (Click to expand)
{
  "identifier": "statuspage_incident_update_sync_status",
  "title": "Update Statuspage Incident Status in Port",
  "description": "Reflect the status of the Statuspage incident in Port",
  "trigger": {
    "type": "automation",
    "event": {
      "type": "RUN_UPDATED",
      "actionIdentifier": "update_statuspage_incident"
    },
    "condition": {
      "type": "JQ",
      "expressions": [
        ".diff.after.status == \"SUCCESS\""
      ],
      "combinator": "and"
    }
  },
  "invocationMethod": {
    "type": "UPSERT_ENTITY",
    "blueprintIdentifier": "statuspageIncident",
    "mapping": {
      "identifier": "{{.event.diff.after.response.id}}",
      "properties": {
        "status": "{{.event.diff.after.response.status}}"
      }
    }
  },
  "publish": true
}
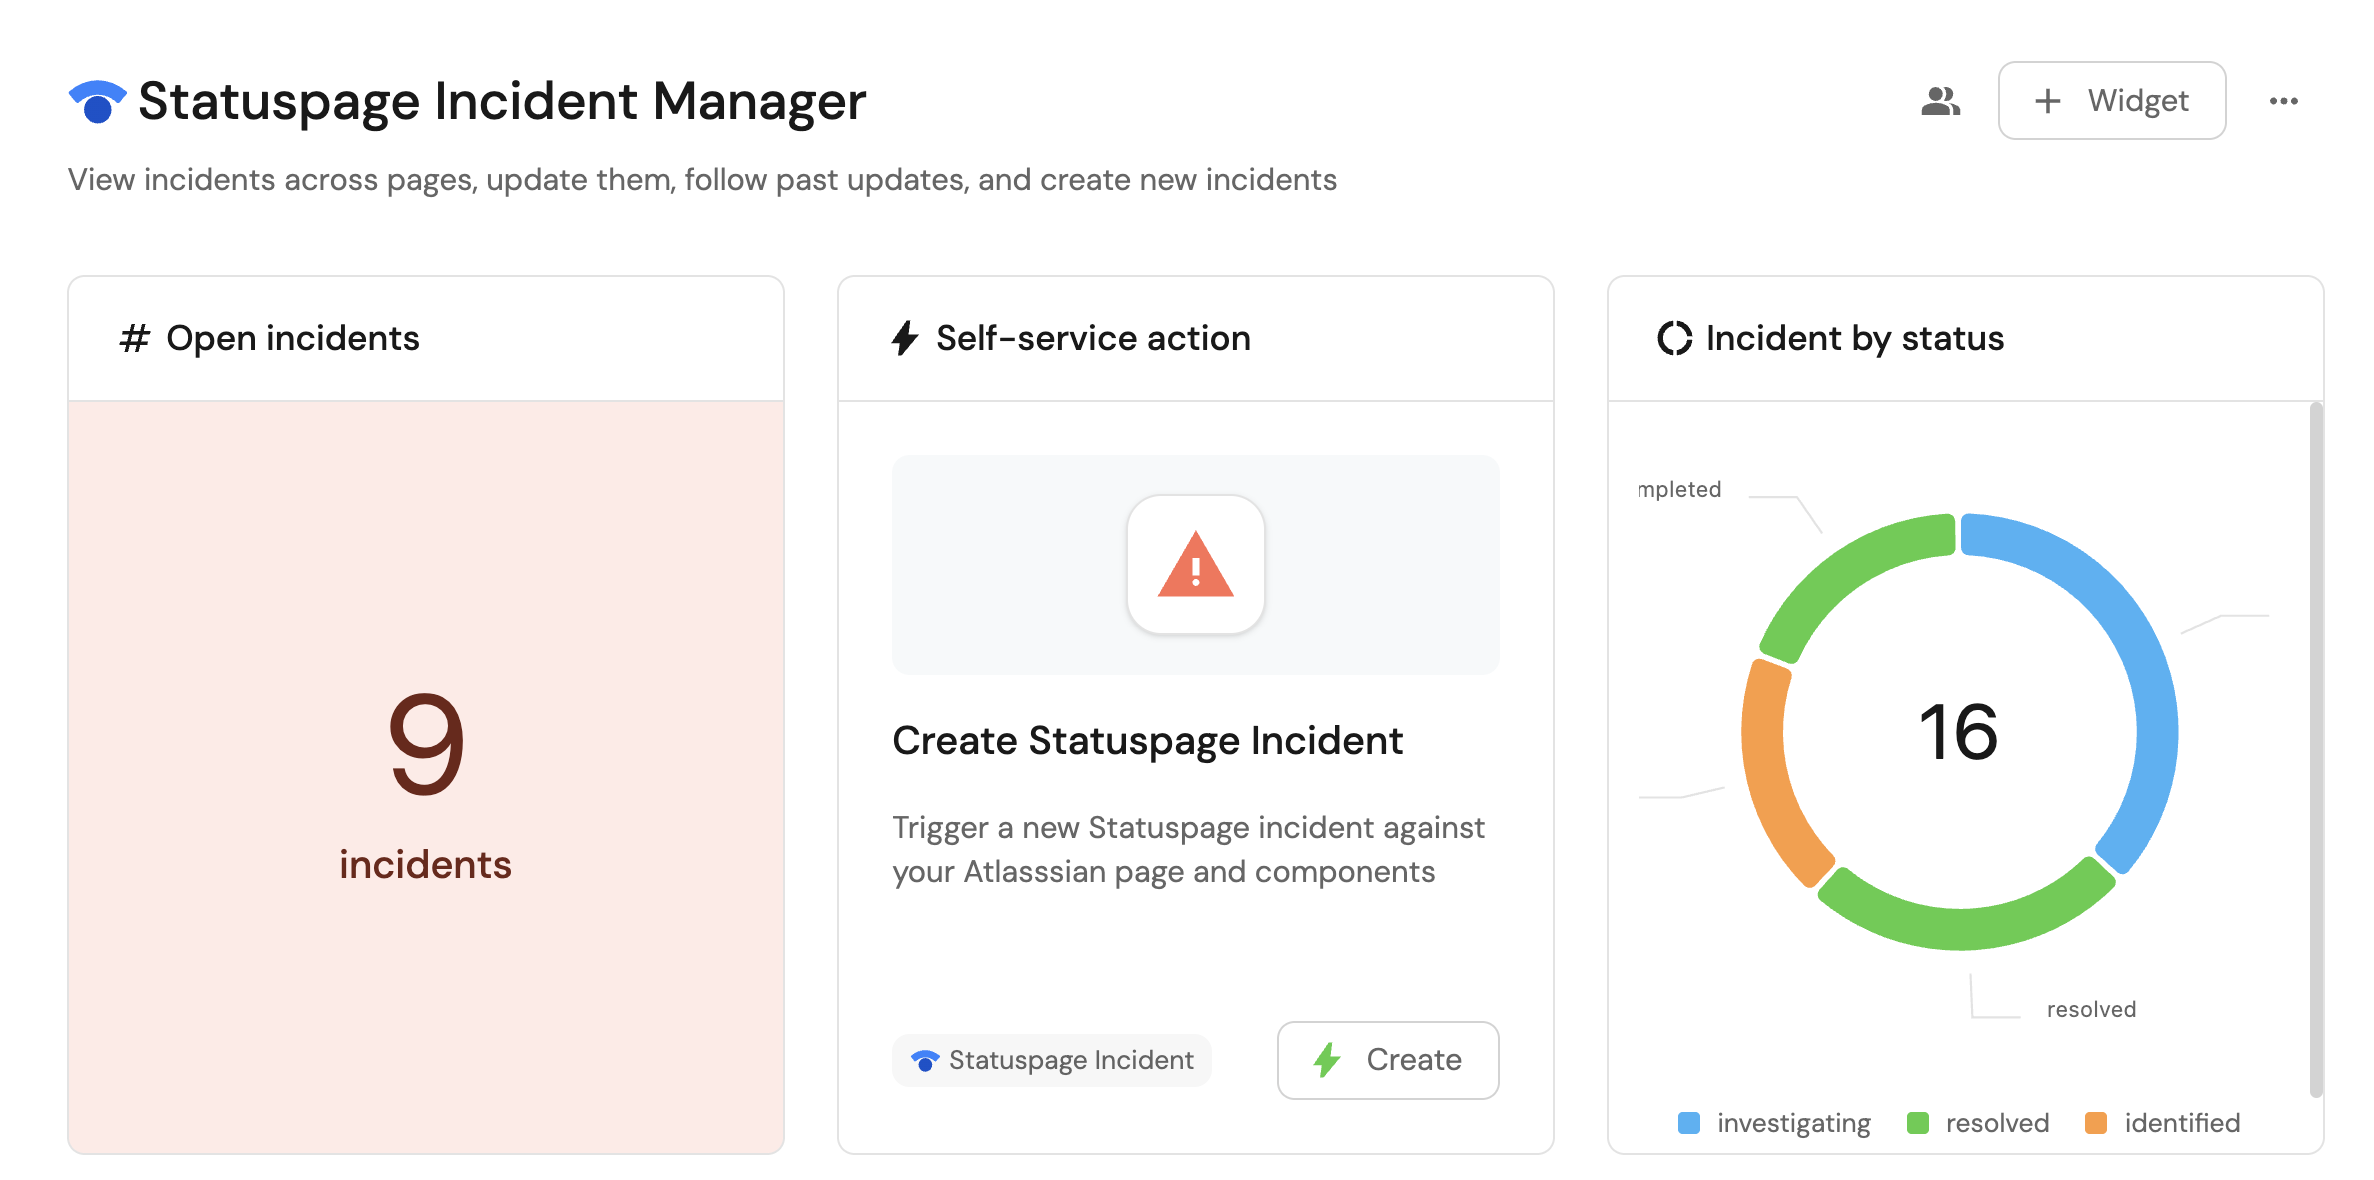
Visualize metrics
With incidents ingested and actions configured, the next step is building a dashboard to monitor Statuspage data directly in Port. We can visualize all incidents using customizable widgets and trigger remediation workflows right from your dashboard.
Create a dashboard
- Navigate to the Catalog page of your portal.
- Click on the
+ Newbutton in the left sidebar. - Select New dashboard.
- Name the dashboard Statuspage Incident Manager.
- Input
Monitor and manage Statuspage incidents across pagesunder Description. - Select the
StatusPageicon. - Click
Create.
We now have a blank dashboard where we can start adding widgets to visualize insights from our Statuspage incidents.
Add widgets
In the new dashboard, create the following widgets:
Total incidents created in the last month (click to expand)
-
Click
+ Widgetand select Number Chart. -
Title:
Incidents in the past month(add theStatusPageicon). -
Select
Count entitiesChart type and choose Statuspage Incident as the Blueprint. -
Select
countfor the Function. -
Add this JSON to the Additional filters editor to filter incidents created in the last month:
[
    {
        "combinator":"and",
        "rules":[
            {
                "property":"createdAt",
                "operator":"between",
                "value":{
                "preset":"lastMonth"
                }
            }
        ]
    }
] -
Select
customas the Unit and inputincidentsas the Custom unit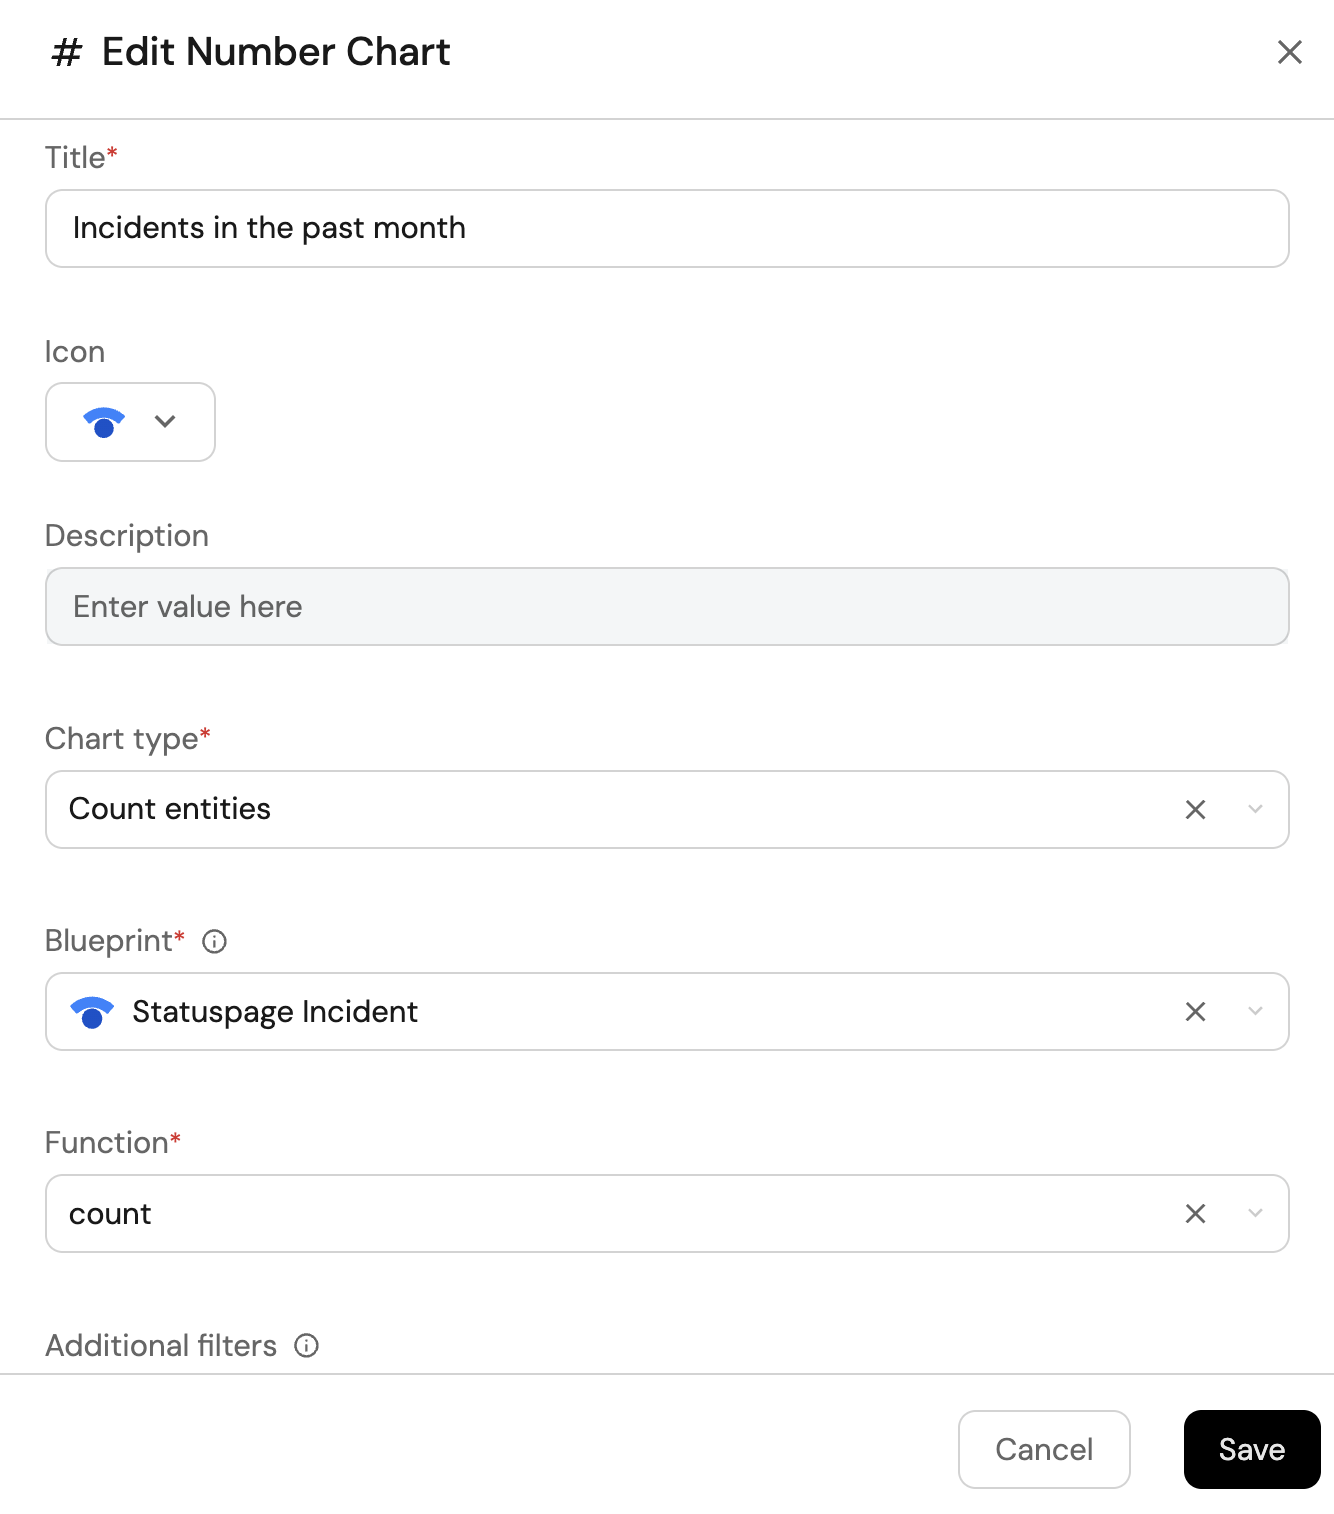
-
Click
Save.
Total resolved incidents (click to expand)
-
Click
+ Widgetand select Number Chart. -
Title:
Resolved incidents(add theStatusPageicon). -
Select
Count entitiesChart type and choose Statuspage Incident as the Blueprint. -
Select
countfor the Function. -
Add this JSON to the Additional filters editor to filter
resolvedandcompletedincidents:[
{
"combinator":"and",
"rules":[
{
"property":"status",
"operator":"in",
"value":["resolved", "completed"]
}
]
}
] -
Select
customas the Unit and inputincidentsas the Custom unit
-
Click
Save.
Total open incidents (click to expand)
-
Click
+ Widgetand select Number Chart. -
Title:
Open incidents(add theStatusPageicon). -
Select
Count entitiesChart type and choose Statuspage Incident as the Blueprint. -
Select
countfor the Function. -
Add this JSON to the Additional filters editor to filter non-resolved incidents:
[
    {
        "combinator":"and",
        "rules":[
            {
                "property":"status",
                "operator":"notIn",
                "value":["resolved", "completed"]
            }
        ]
    }
] -
Select
customas the Unit and inputincidentsas the Custom unit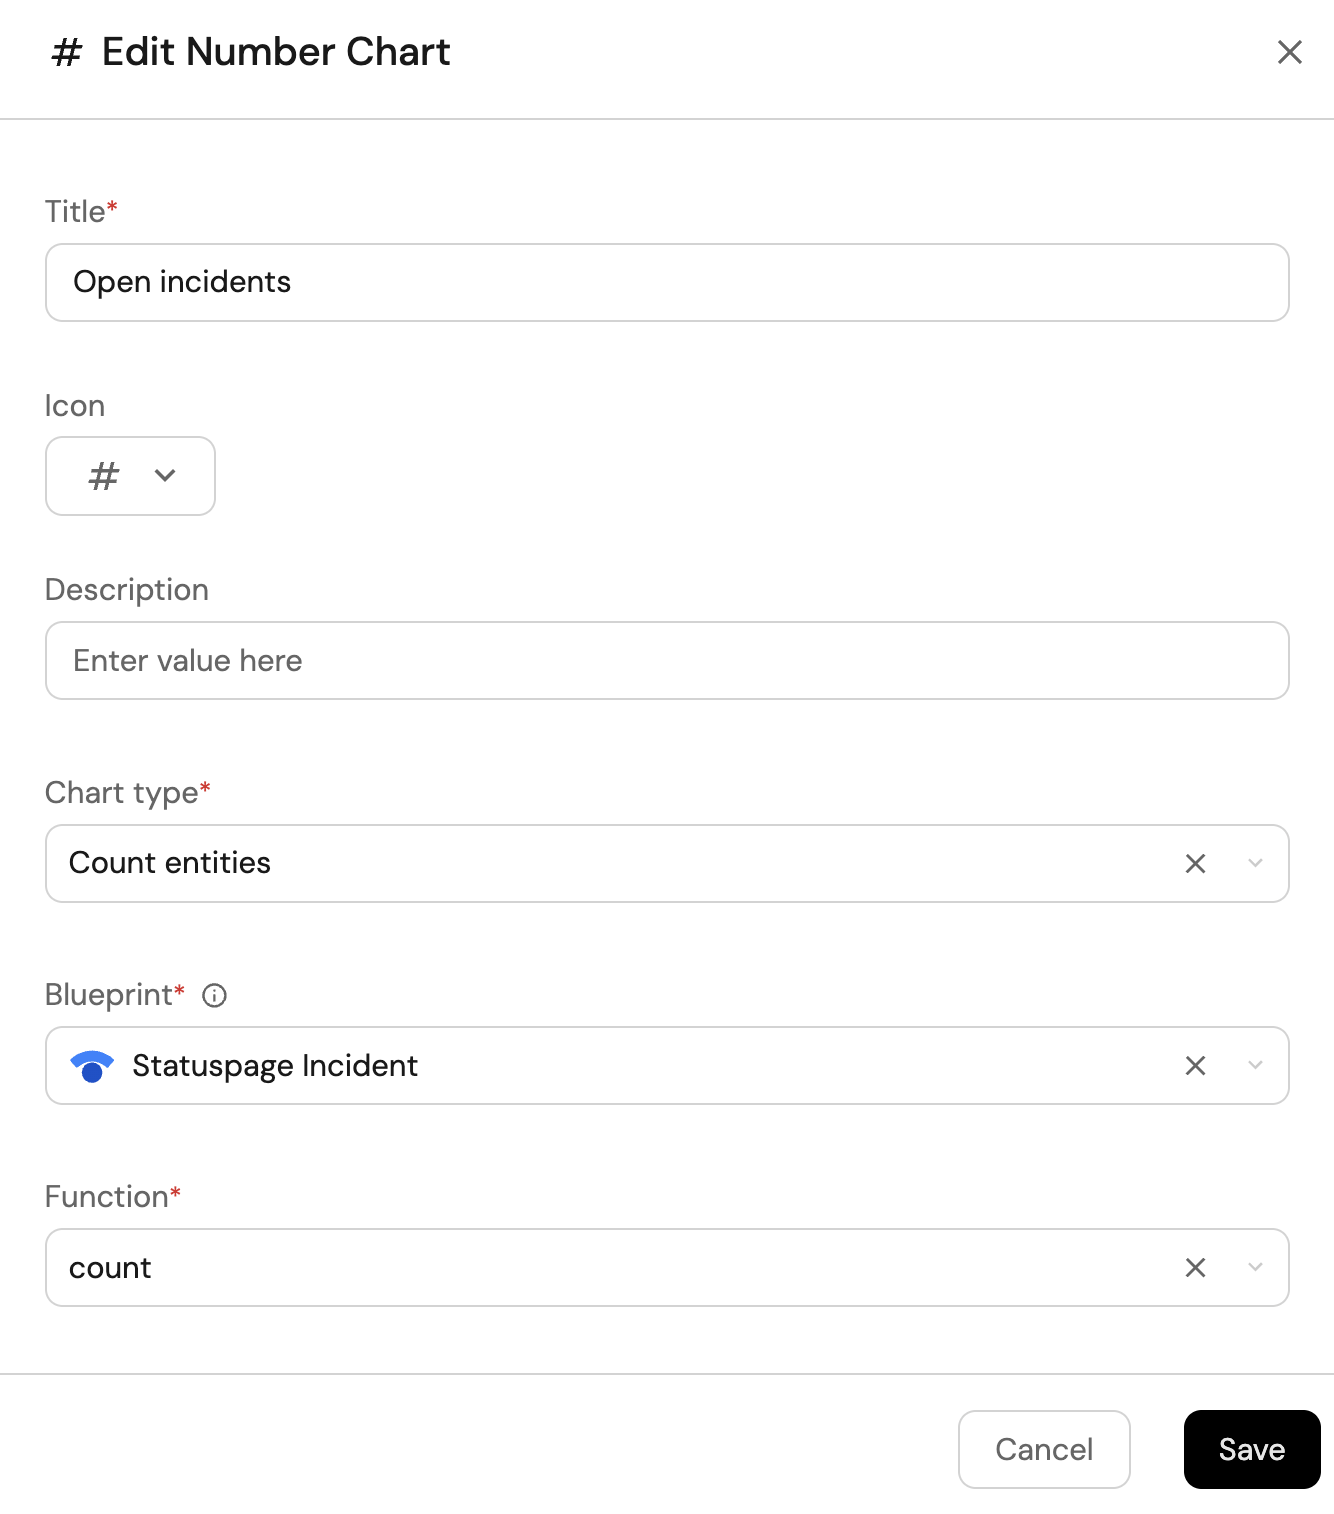
-
Click
Save.
Incidents by status (click to expand)
-
Click
+ Widgetand select Pie chart. -
Title:
Incidents by status(add theStatusPageicon). -
Choose the Statuspage Incident blueprint.
-
Under
Breakdown by property, select the Status property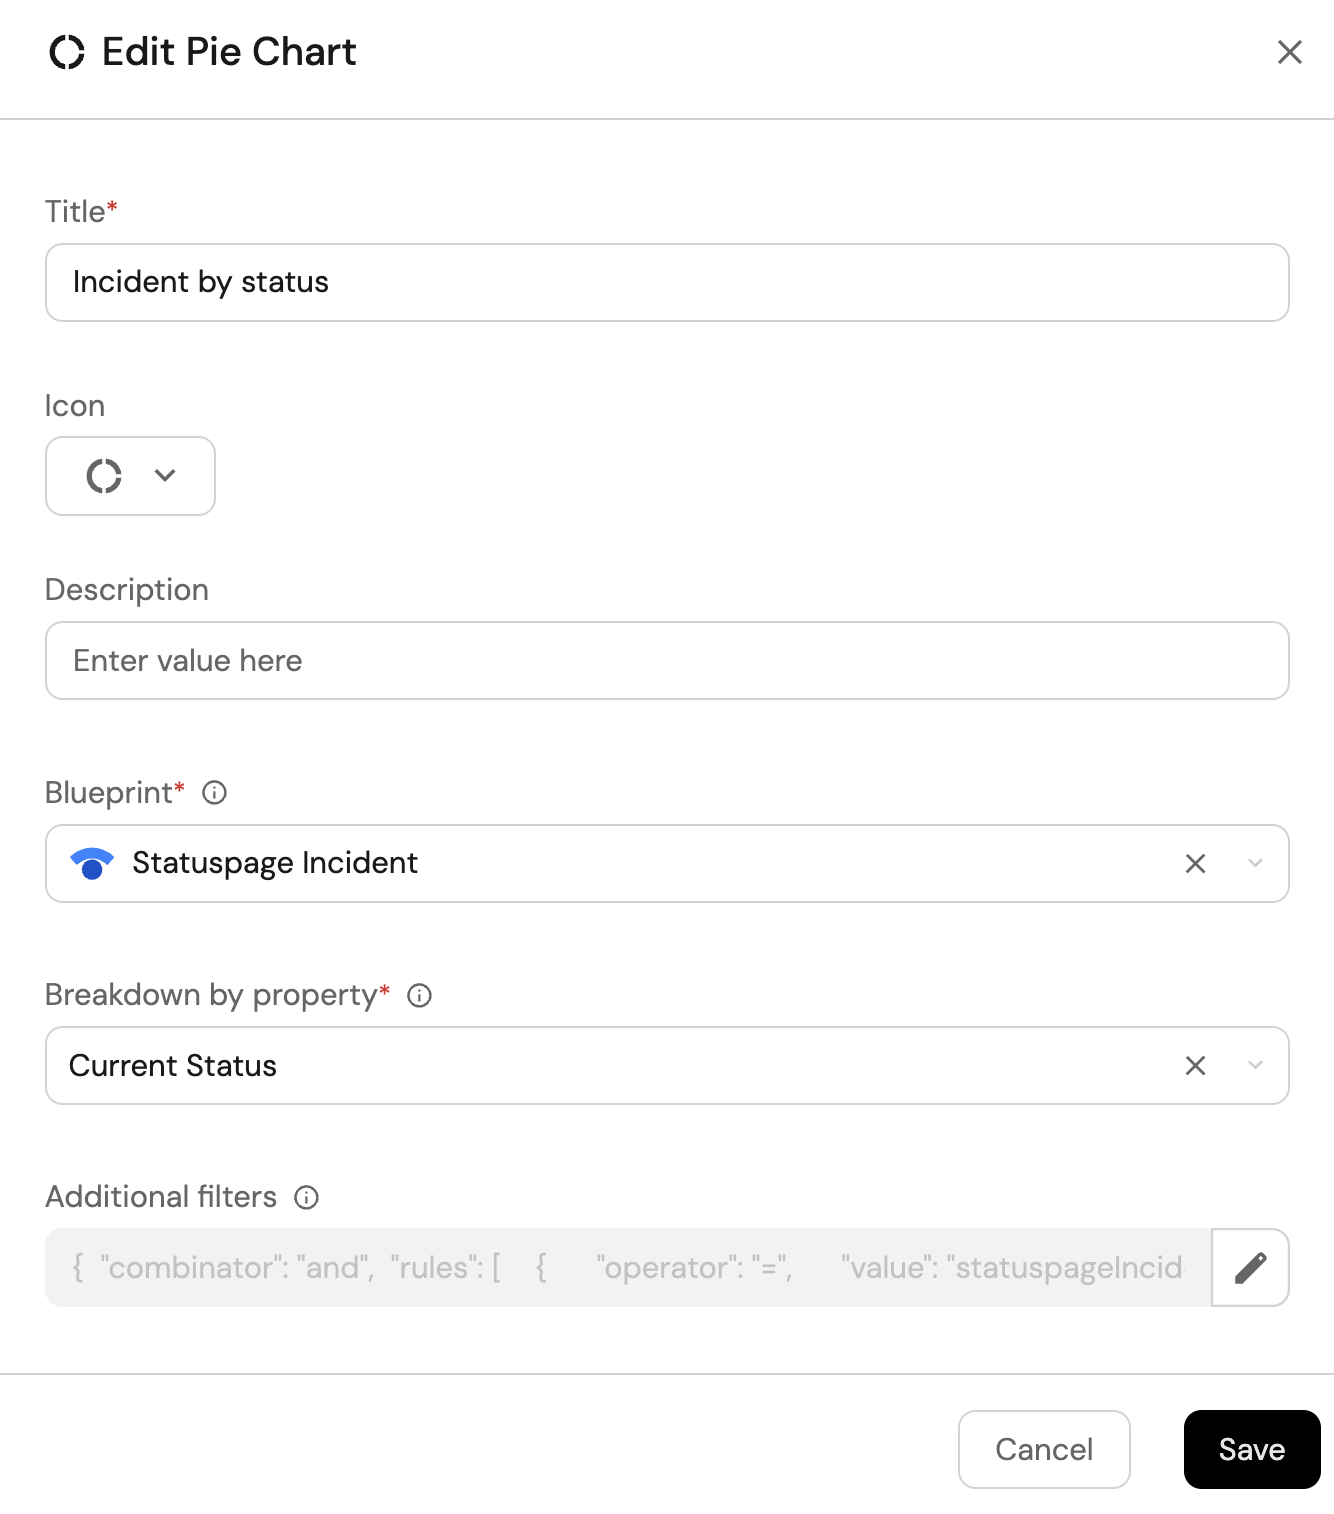
-
Click Save.
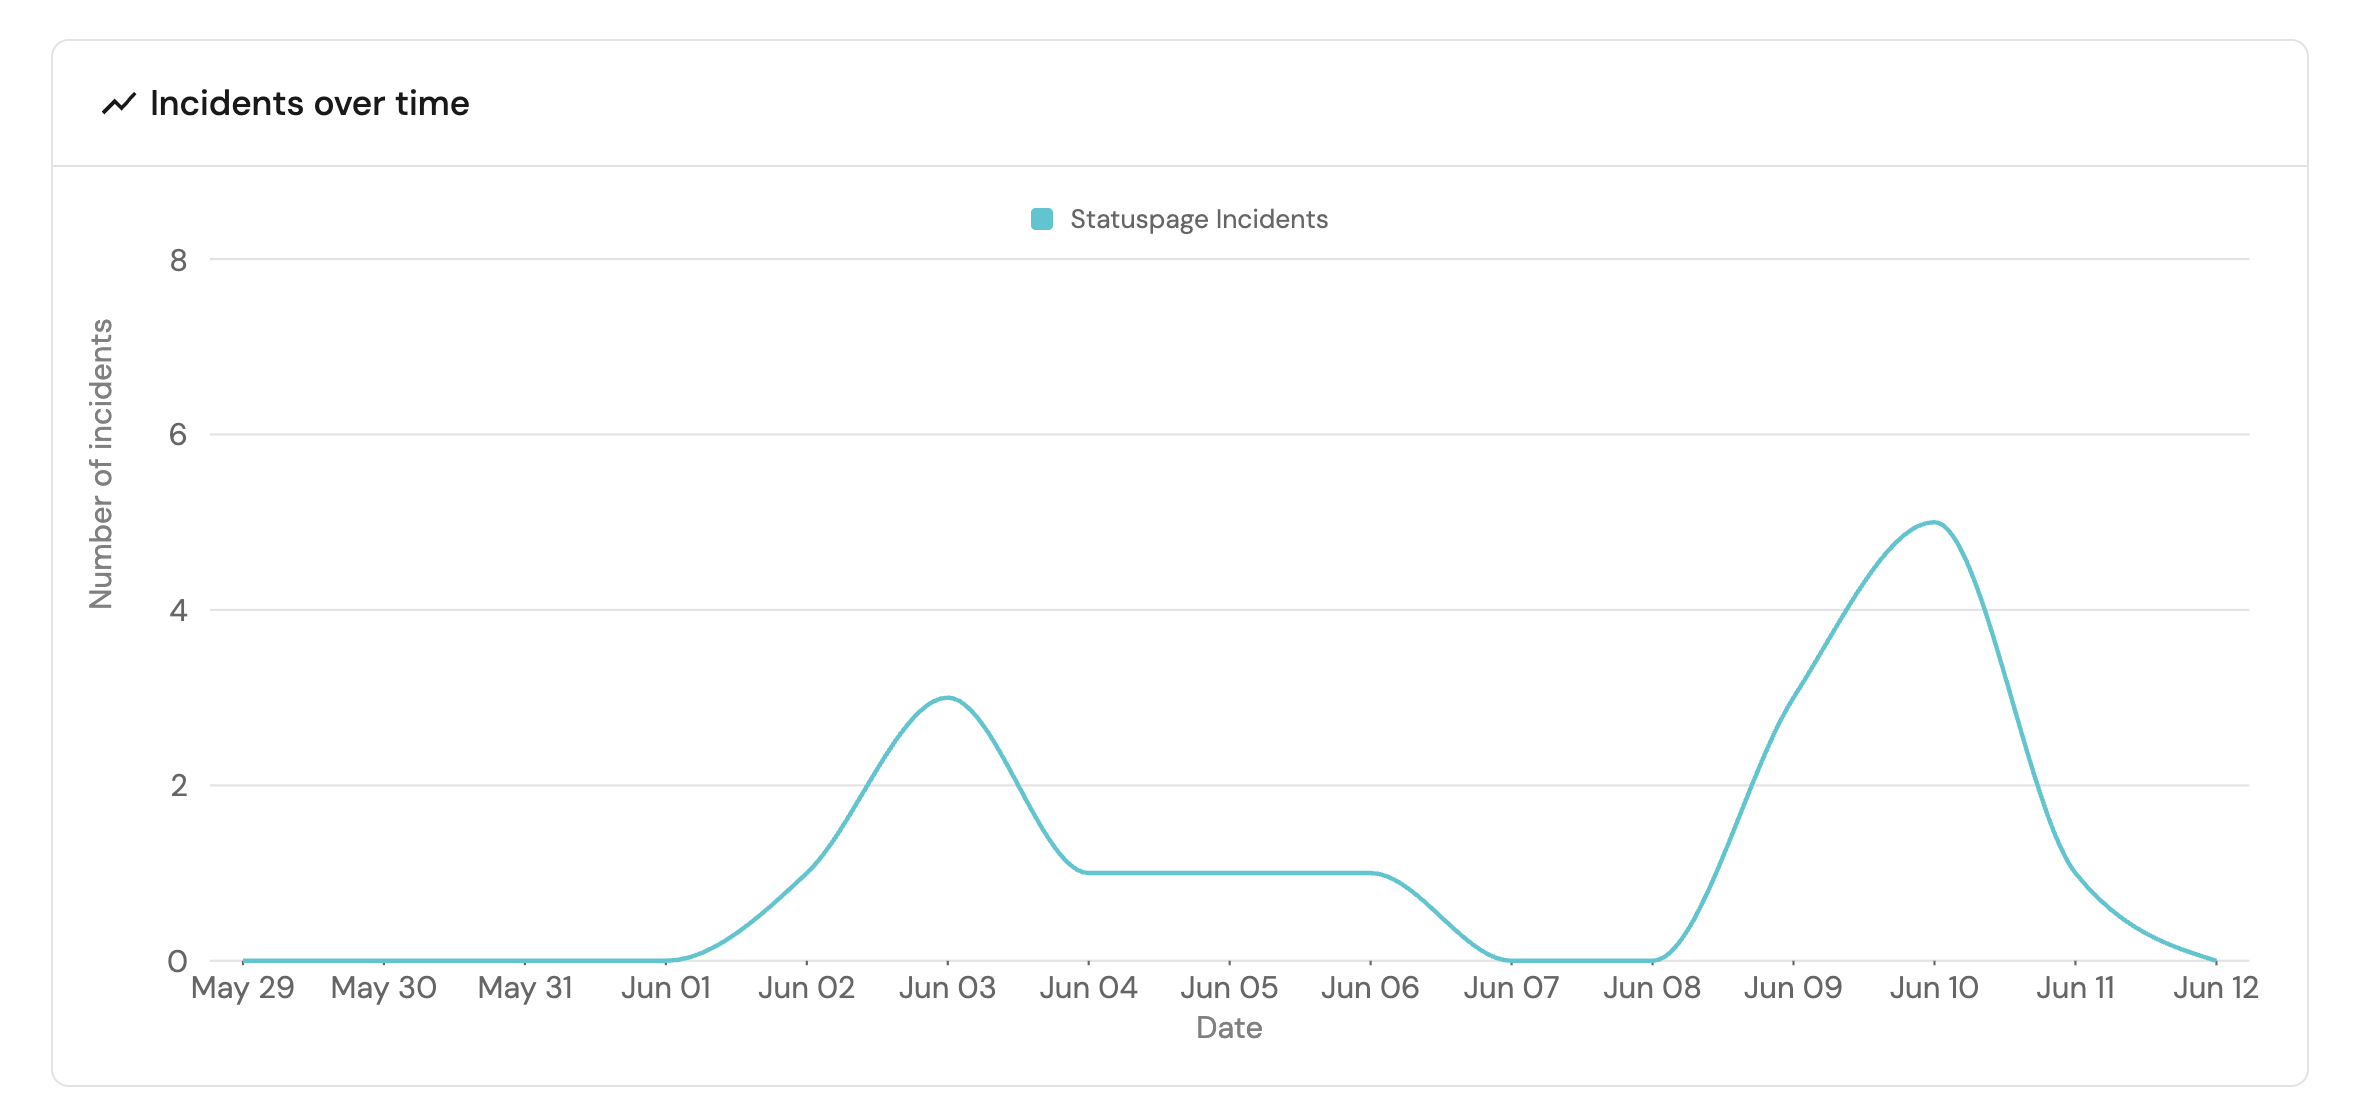
Incidents over time (click to expand)
-
Click
+ Widgetand select Line Chart. -
Title:
Incidents over time, (add theLineCharticon). -
Select
Count Entities (All Entities)Chart type and choose Statuspage Incident as the Blueprint. -
Input
Number of incidentsas the Y axis Title. -
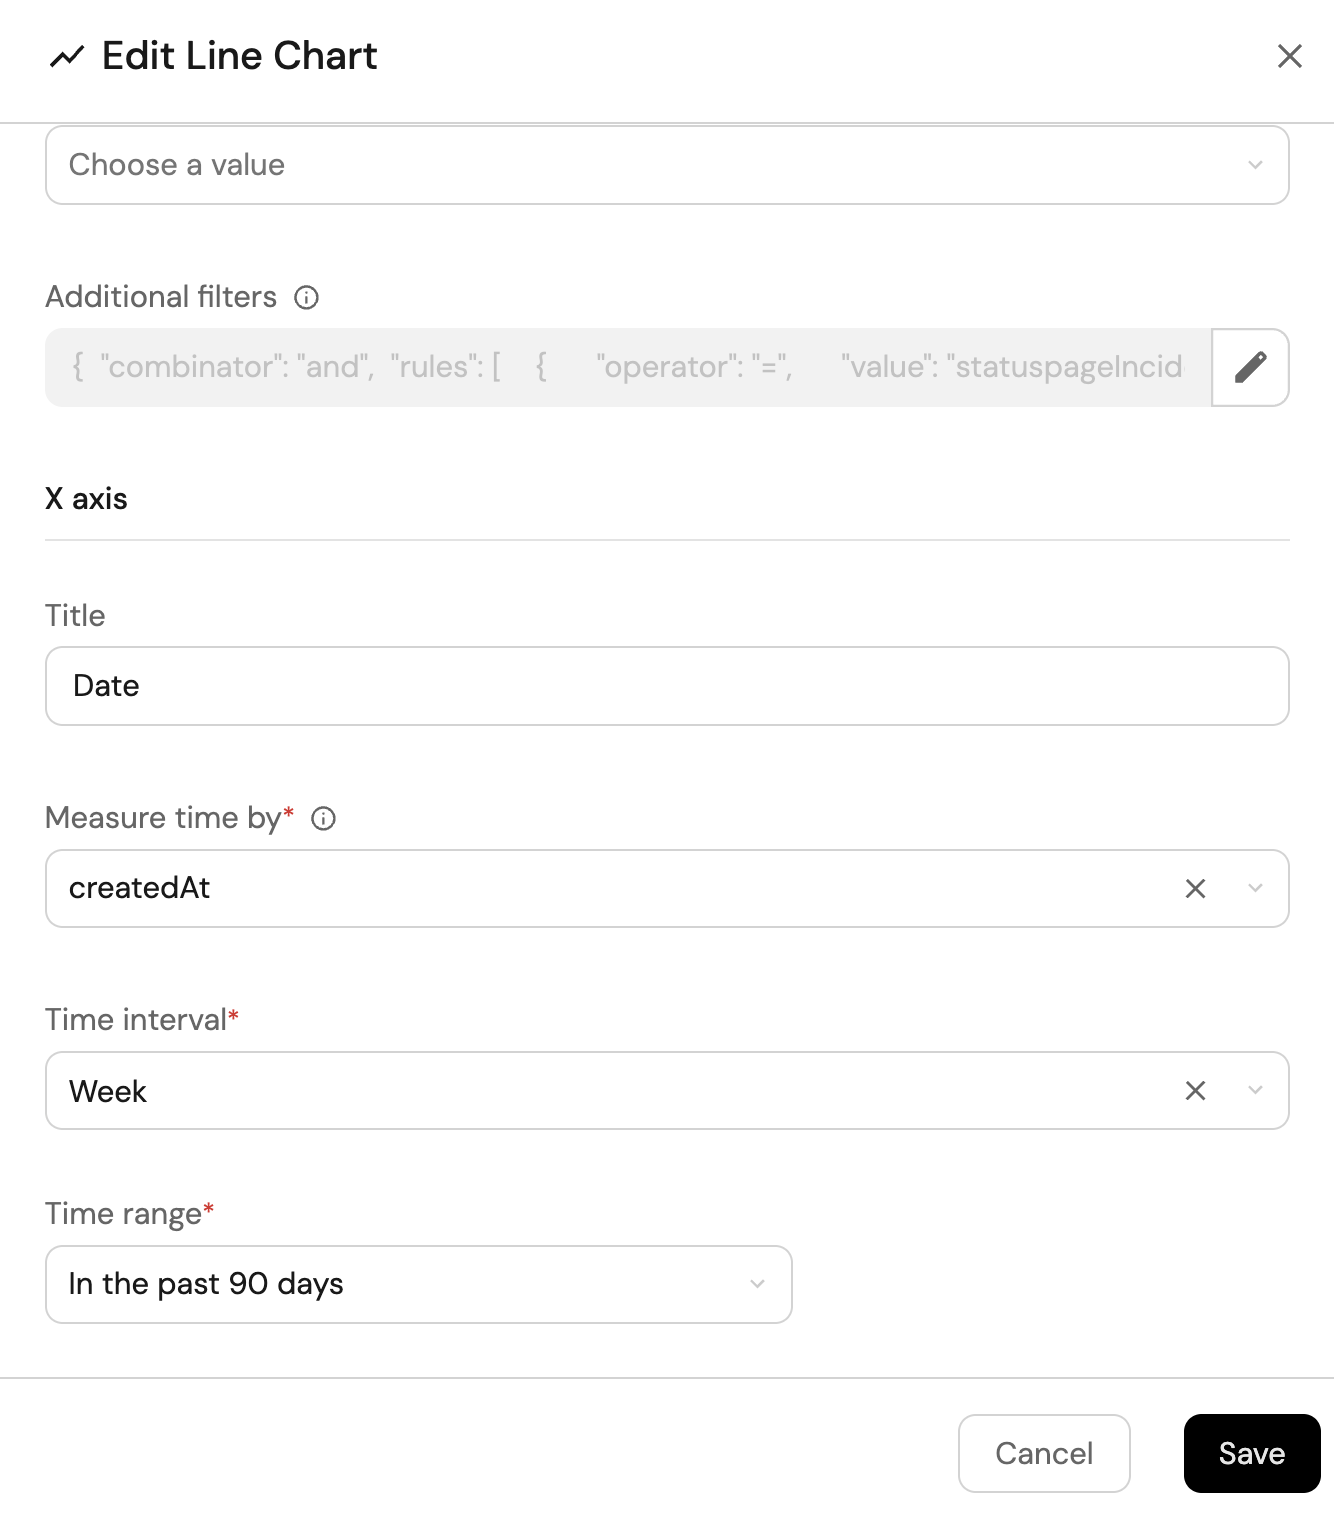
Set
countas the Function. -
Input
Dateas the X axis Title and choosecreatedAtas the Measure time by. -
Set Time Interval to
Weekand Time Range toIn the past 90 days.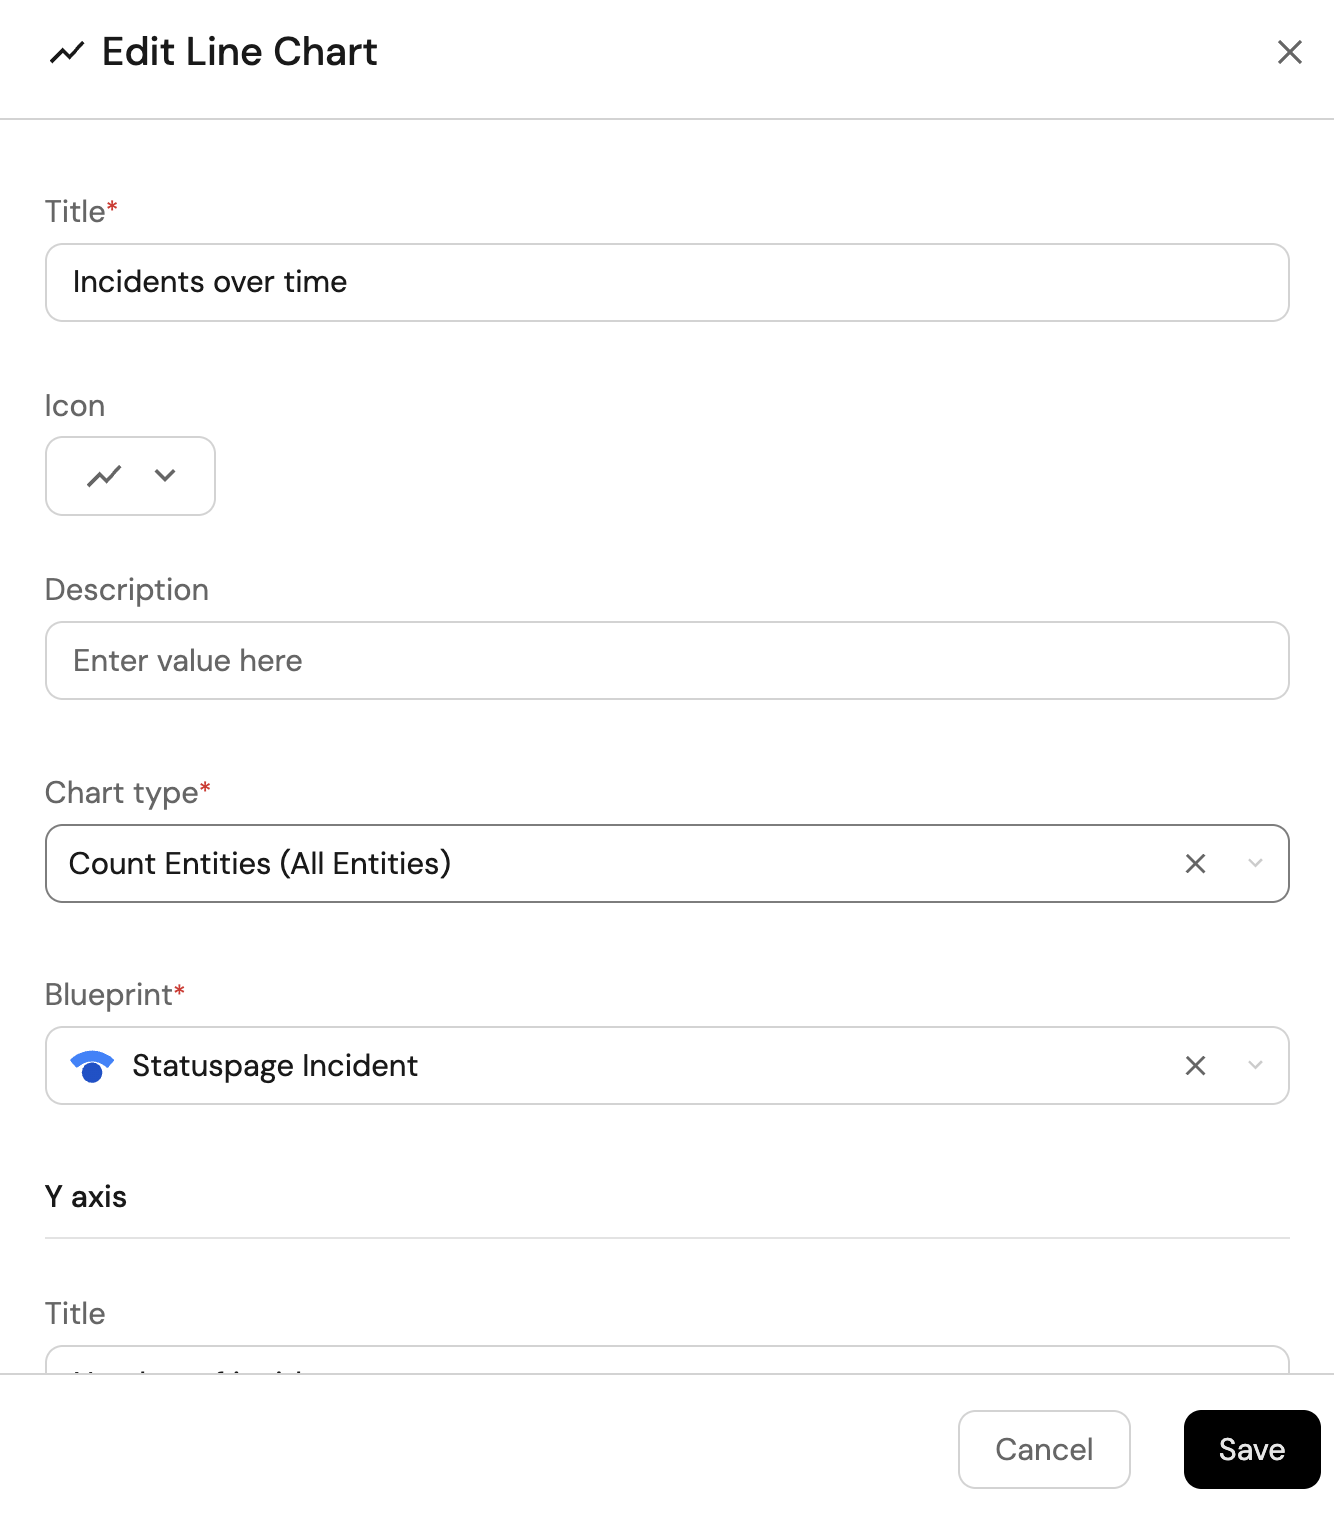
-
Click
Save.
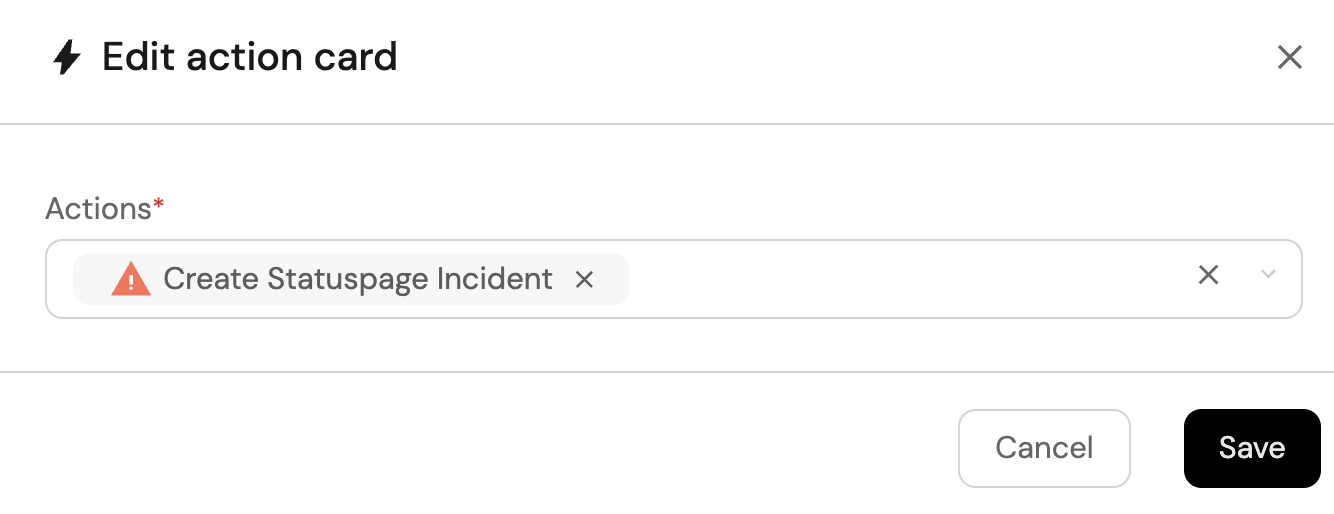
Create incident action (click to expand)
-
Click
+ Widgetand select Action card. -
Choose the Create Statuspage Incident action we created in this guide
-
Click Save.
All Incidents in the past month table (click to expand)
-
Click
+ Widgetand select Table. -
Title the widget Incidents in the past month.
-
Choose the Statuspage Incident blueprint

-
Add this JSON to the Additional filters editor to filter incidents created in the last month:
{
  "combinator": "and",
  "rules": [
    {
      "operator": "between",
      "property": "createdAt",
      "value": {
        "preset": "lastMonth"
      }
    },
    {
      "operator": "=",
      "value": "statuspageIncident",
      "property": "$blueprint"
    }
  ]
} -
Click Save to add the widget to the dashboard.
-
Click on the
...button in the top right corner of the table and select Customize table. -
In the top right corner of the table, click on
Manage Propertiesand add the following properties:- Status: The current status of the incident.
- Impact: The impact level of the incident
- Message: The incident message.
- Created At: The date the incident was created.
- Updated At: The date the incident was last updated.
- Status Page: The related Statuspage.
- Components: The affected components.
-
Click on the save icon in the top right corner of the widget to save the customized table.
Total affected components (click to expand)
-
Click
+ Widgetand select Number Chart. -
Title:
Affected components(add theStatusPageicon). -
Select
Count entitiesChart type and choose Statuspage Component as the Blueprint. -
Select
countfor the Function. -
Add this JSON to the Additional filters editor to filter non operational components:
[
    {
        "combinator":"and",
        "rules":[
            {
                "property":"status",
                "operator":"!=",
                "value":"operational"
            }
        ]
    }
] -
Select
customas the Unit and inputcomponentsas the Custom unit
-
Click
Save.